BUGS

Your code will break and it will break a lot. Using Xcode, you can add breakpoints to determine where in your wonderfully written code it's breaking.
Simple Breakpoints:

Adding a simple breakpoint (seen from screenshot above). When you go to run your app, it will hit the breakpoint(s) you placed when it reaches this point in the execution of your app. To remove the breakpoint, you can simply drag it off the line number you placed it on. Keep in mind that you can add breakpoints in your code after you've hit run as well as it's sitting idle at a previous breakpoint. Adding a breakpoint is as simple as clicking the line number next to the code where you would like your code to pause. As it's paused on your breakpoint, you can print objects in the debugger and even call methods on various objects. If Jim is an instance of a Student class, I can type "po Jim" in the console to see if Jim actually exists (an instance has been created). You can even call methods as in "po [myArray objectAtIndex: 0]". If a variable should be 25 at a certain point, you can add a breakpoint then po that variable and see what the value is in the console.
Conditional Breakpoints:


First add a breakpoint to your project. Then right click the breakpoint, click "Edit Breakpoint....". Then where it states Condition, you can put in any condition you like so that way the application will stop when it meets the condition you inputted here. You've just created a conditional breakpoint! In a quick example, I will put this to use so you can see how it might be useful to you. If there's a class of hundreds or even thousands of students and there seems to be a problem in your for loop where you don't know why it's not adding something correctly, by simply adding a breakpoint - you will have to step through the method over and over to try to find where the problem is, this is not efficient nor best practice. By editing the breakpoint to add a condition like I inputted above, it will run through the for loop (where we placed the breakpoint) until the condition is met. See the example below:

The NSLog statement is printing 3,080. This can't be possible, with 5 students and 20 labs that can be completed by each student, the maximum amount labsCompleted can equal is 100. Some student either hacked our system or there was input error. We will add a conditional breakpoint on line 29 adding the condition (as seen from the screenshot above - "student.labsCompleted > 20".)
After adding our conditional breakpoint and re-running our project, we are met with the following in our console:

Our bug has been found! It seems Jim is trying to inflate the number of labs he completed in his class. Either way, we didn't have to step through every single student in the for loop to find out what was causing our figure to be so out of whack.
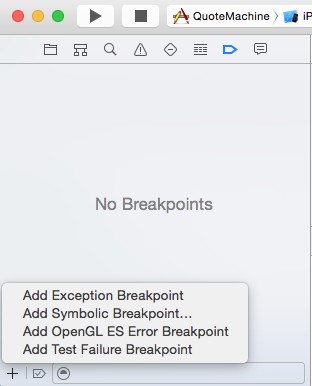
Symbolic Breakpoints:
Symbolic breakpoints allow you to set breakpoints based on a symbol, like a method or function name regardless of where it might appear in cold or wherever specific selectors are sent messages. If you would like to know when viewDidLoad is called on (every single time) then you would add a symbolic breakpoint for "viewDidLoad". It will even show you the line number it's getting called on.

In my quote matching game, I want to see when someone is making their guess as it doesn't seem to be working right. Here is the method that checks to see if the person guessed correctly:

Using a symbolic breakpoint (see screenshot above), we will check to see all the places this is getting called in our project. We can then properly debug our project if see it getting called at the wrong time or in too many places. The demo below showcases the symbolic breakpoint. Running the application, it seems to be getting called at the correct time. I could have just as easily set a simple breakpoint in this method but for simplicity I'm just highlighting how to use the symbolic breakpoint.
